HIV Lens data methods
HIV Lens allows users to search HIV data by age, exposure group, age and geographic region, where available. Data have been produced by the UK Health Security Agency and all information presented is in the public domain as official statistics or published reports.
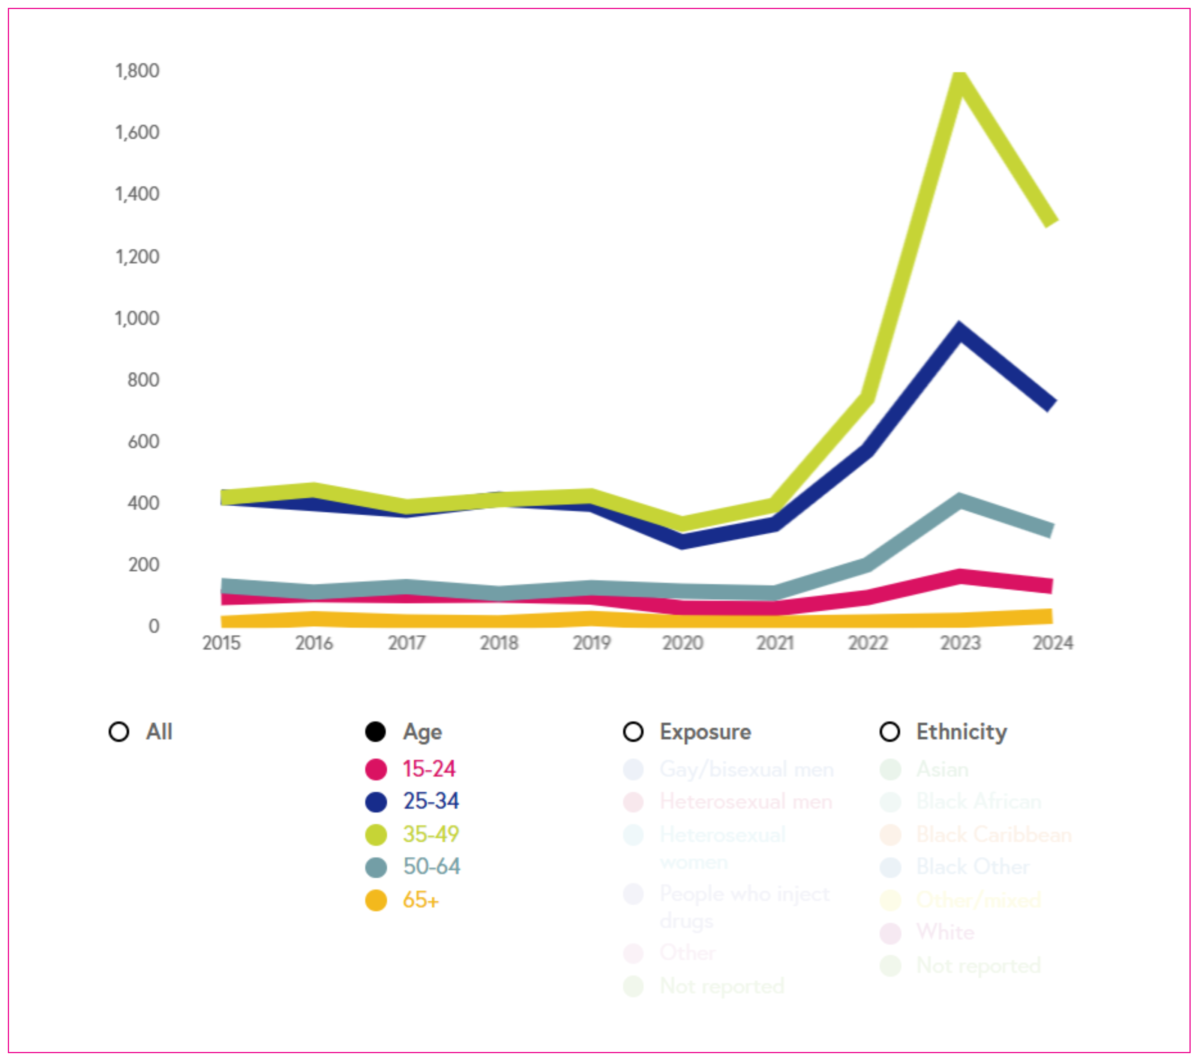
People diagnosed before continuing HIV care in England
The number of people diagnosed before continuing care in England.
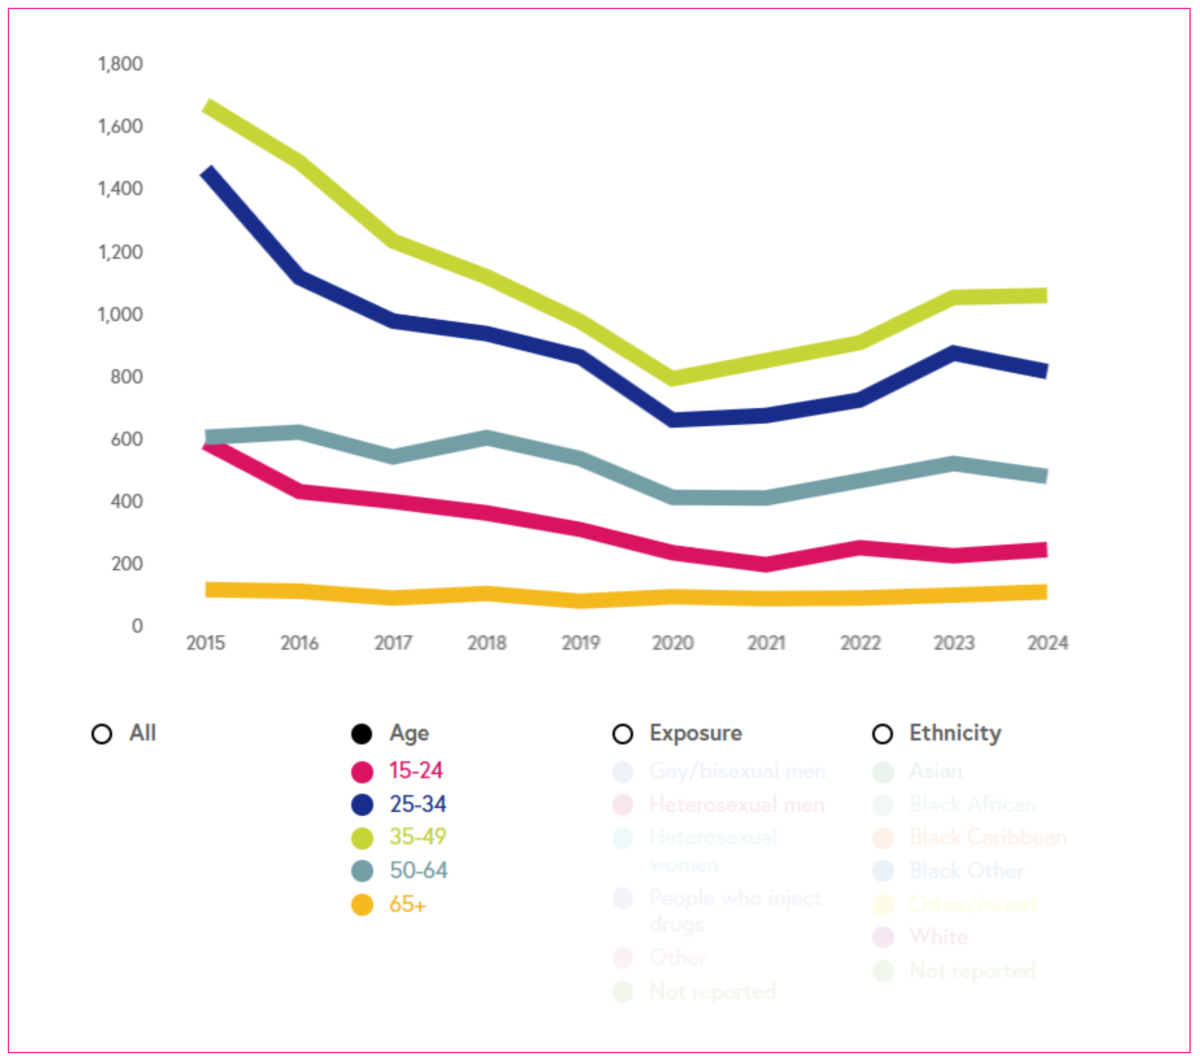
New HIV diagnoses
The data show new HIV diagnoses, excluding people who were diagnosed before arriving in England.
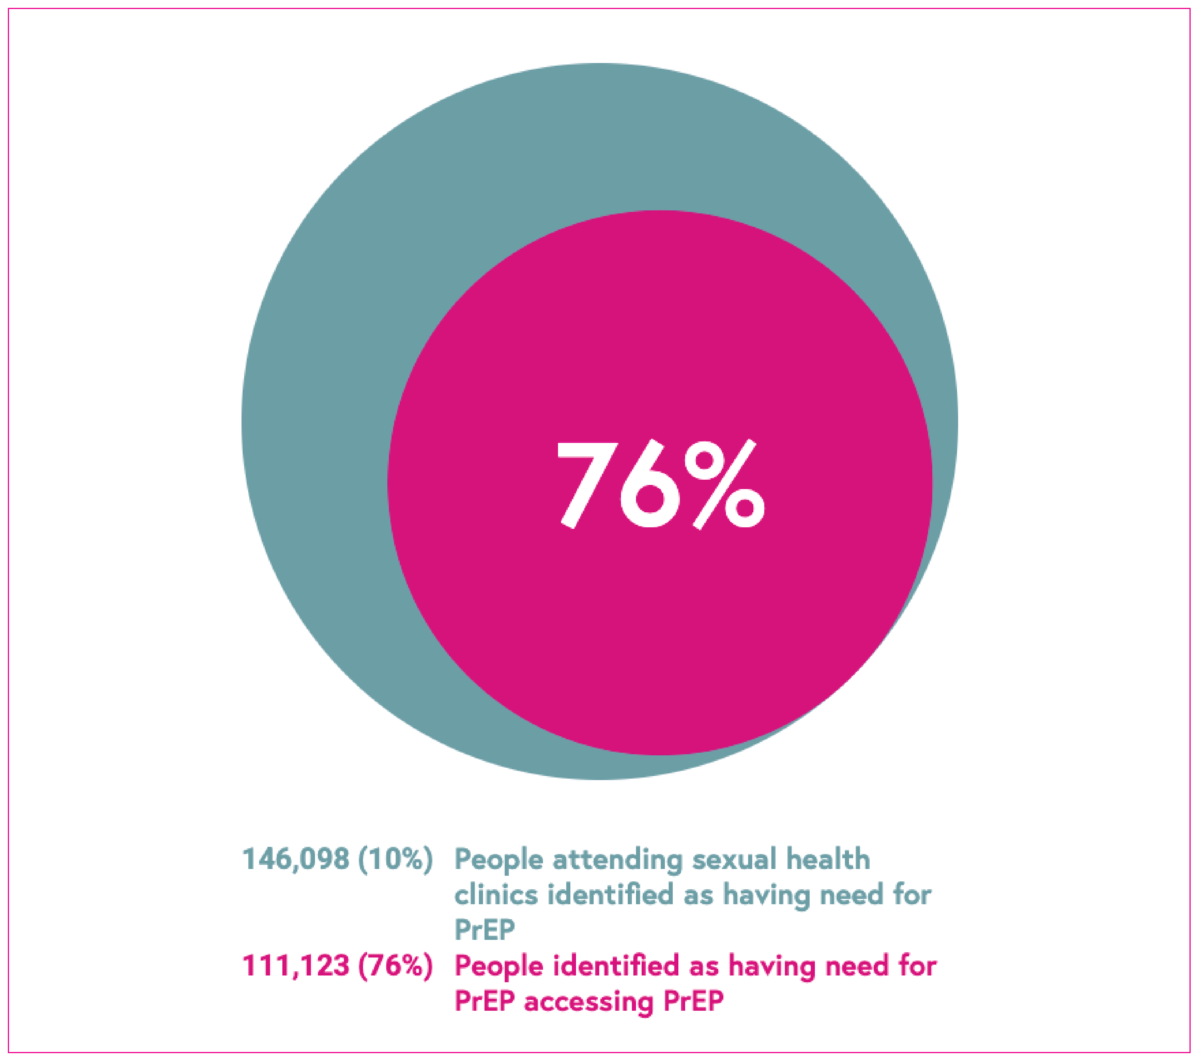
PrEP
This indicator shows the number of people attending sexual health services identified as having need for PrEP, and the proportion accessing PrEP.
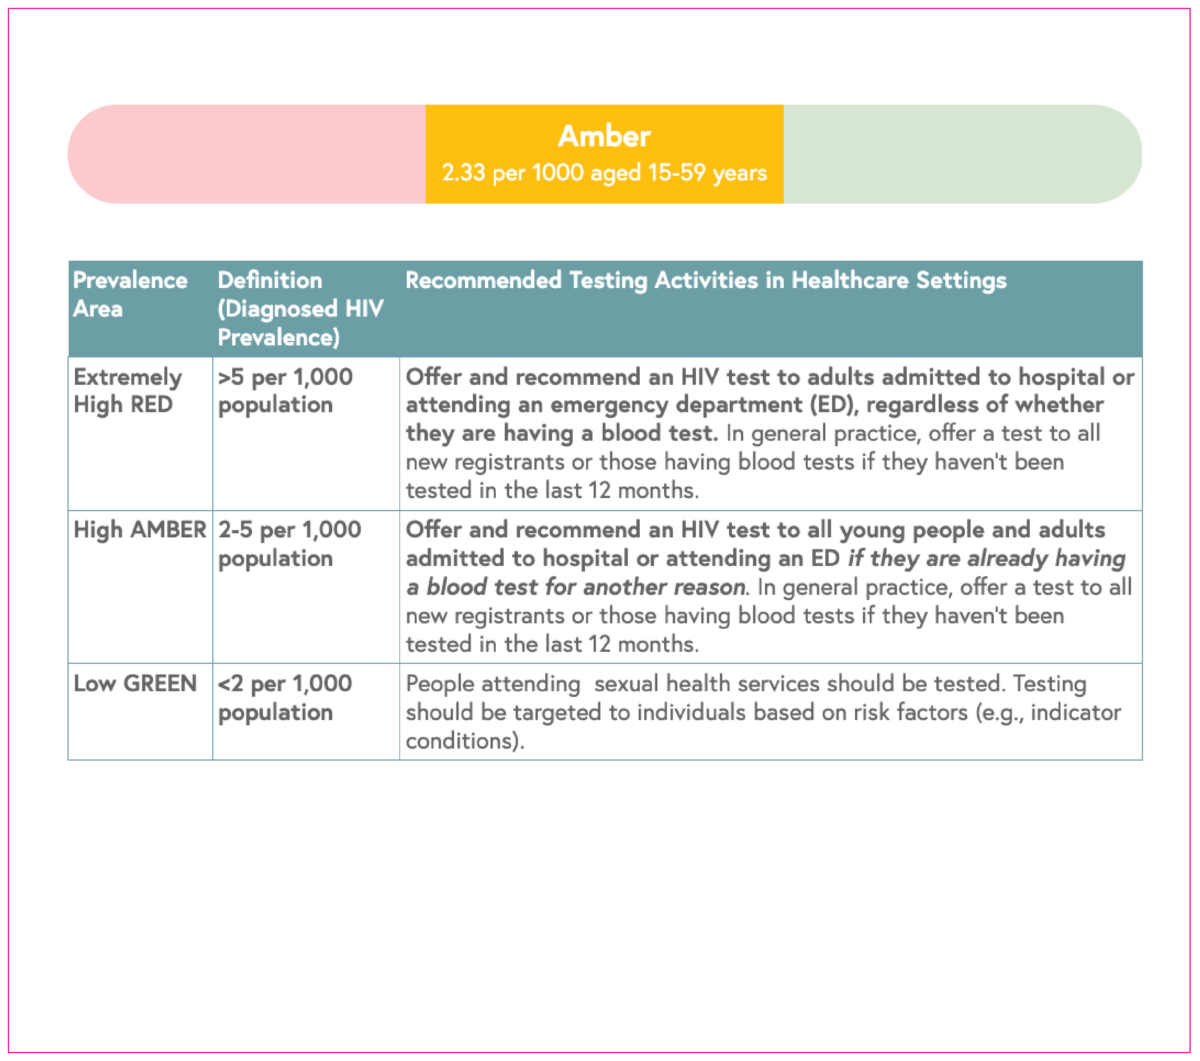
HIV testing guidelines
This indicator shows a red (extremely high), amber (high) or green (low) prevalence rating, which is used to inform HIV testing guidelines.
HIV testing rate
This measure shows the proportion of people living in a specific area who had an HIV test at a sexual health clinic.
Proportion of people declining a test
The proportion of people attending a sexual health service who were offered, but declined, an HIV test.
Late diagnoses
The number and proportion of HIV diagnoses made at a late stage of infection.
Living with diagnosed HIV
The data show the rate of people living with a diagnosed HIV infection per 1,000 people aged 15-59 years, which is used to inform HIV testing guidelines, and the number of people.
Treatment started within 91 days
The proportion of people who started treatment within 91 days of HIV diagnosis.
HIV treatment coverage
The percentage of people with diagnosed HIV receiving HIV treatment.
Viral suppression
Proportion of people with diagnosed HIV receiving treatment who are virally suppressed.
Retention in care
The proportion of people seen for HIV care who are seen on an annual basis.
HIV stigma
Data from the Positive Voices survey on stigma in healthcare settings, anticipated stigma, and sharing one’s HIV status.
Needs of people living with HIV
Data from the Positive Voices survey on the 'need' and 'unmet need' for services of people living with HIV.
Indicator
Definition
People diagnosed before continuing HIV care in England
The number of people diagnosed before continuing care in England. These data should not be used to monitor transmission. Most of these people were treated and virally suppressed and rapidly linked to care on arrival into England, ensuring good health and preventing onward transmission.
Breakdown: age, exposure, ethnicity (where available), and geographic region.
New HIV diagnoses
New HIV diagnoses are used as proxy for HIV transmission in the HIV Action Plan. Diagnoses exclude people who were diagnosed before arriving in England. New diagnoses must be interpreted together with trends in HIV testing. If new HIV diagnoses decrease at the same time as HIV testing rises or stays the same, this indicates a fall in transmission. The new HIV Action Plan aims to reduce HIV diagnoses by 90% between 2010 and 2030.
Breakdown: age, exposure, ethnicity (where available), and geographic region.
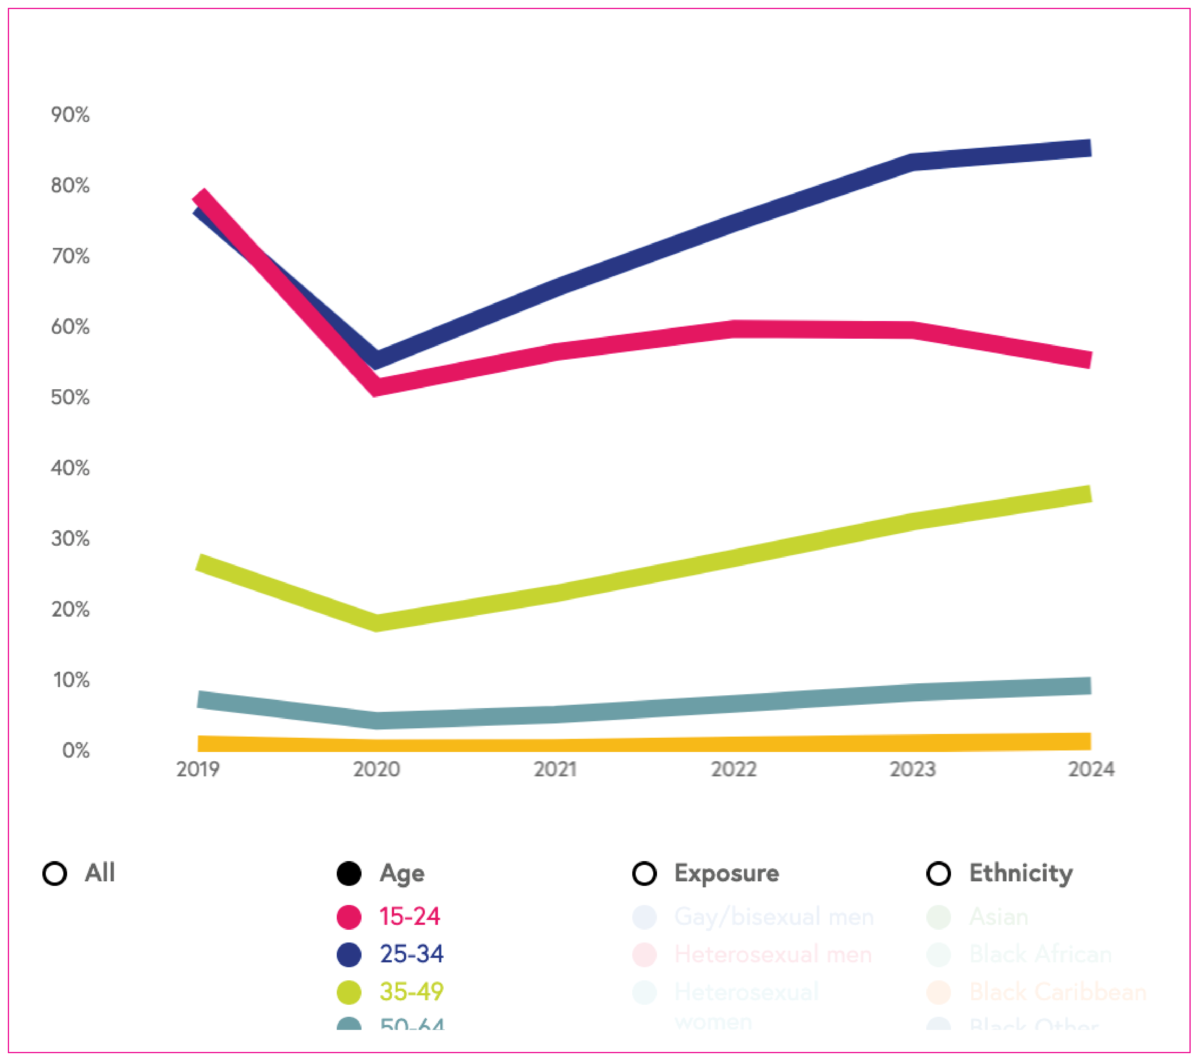
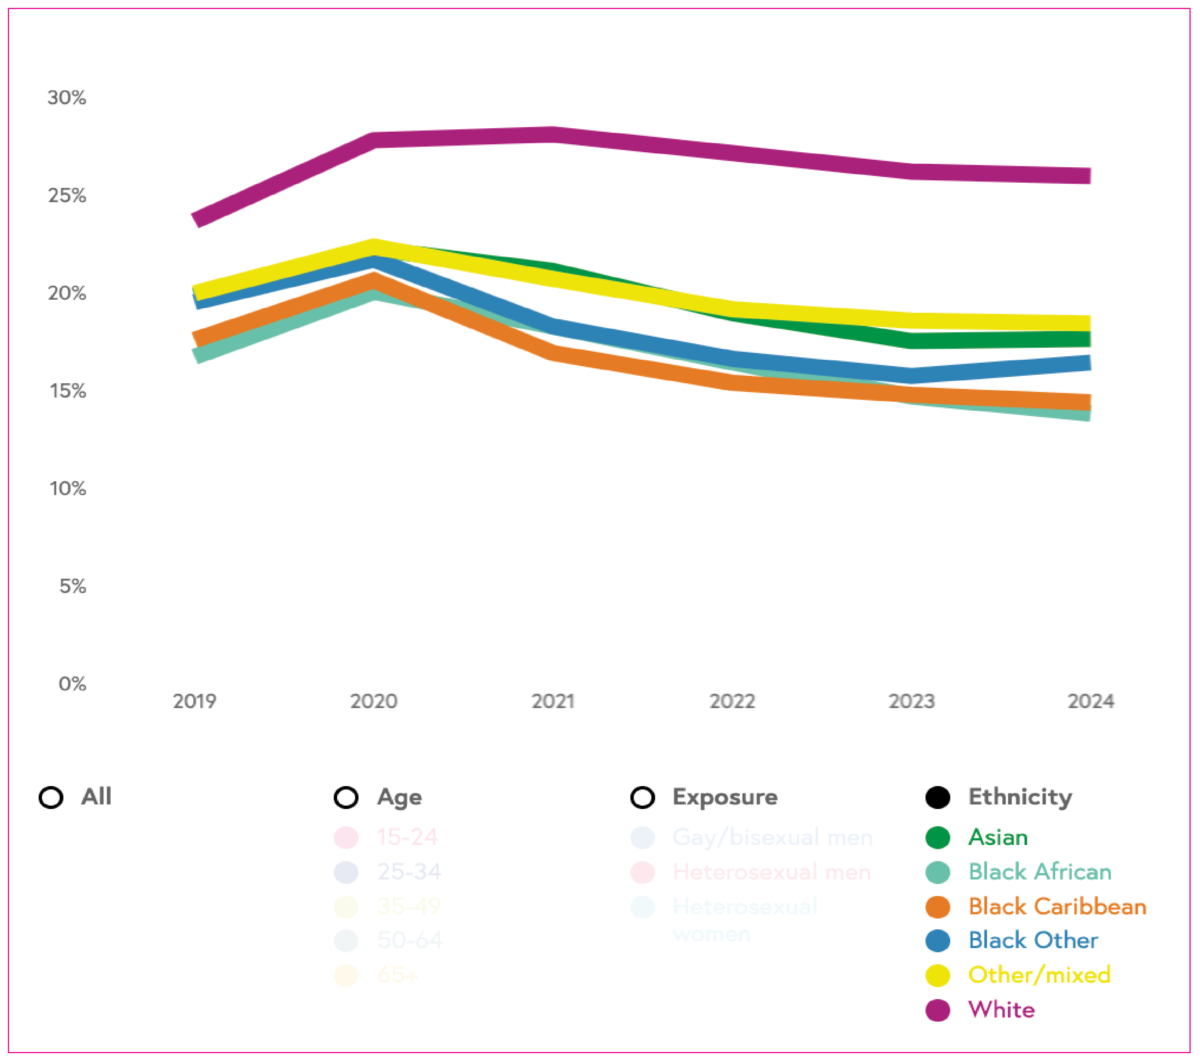
PrEP
Pre-exposure prophylaxis (PrEP) is a drug taken by HIV-negative people prior to sex to stop HIV acquisition. As part of a combination approach to HIV prevention, the roll out of routine PrEP commissioning began in England in the autumn of 2020. Specialist sexual health services (SHS) are responsible for the delivery of PrEP to those at higher risk of acquiring HIV.
Two indicators are presented.
Determining PrEP need. This indicator is used to determine PrEP need among people accessing specialist SHS. It assesses the proportion of all HIV-negative people accessing specialist SHS who are at substantial HIV risk, and therefore could benefit from receiving PrEP. This shows which populations are in highest need of PrEP. The percentage shows what proportion of people in sexual health services are in need of PrEP.
Initiation or continuation of PrEP among those with PrEP need. This indicator assesses what proportion of individuals accessing specialist SHS with PrEP need start or continue PrEP. The higher the percentage, the better.
Breakdown: age, exposure, ethnicity (where available), and geographic region.
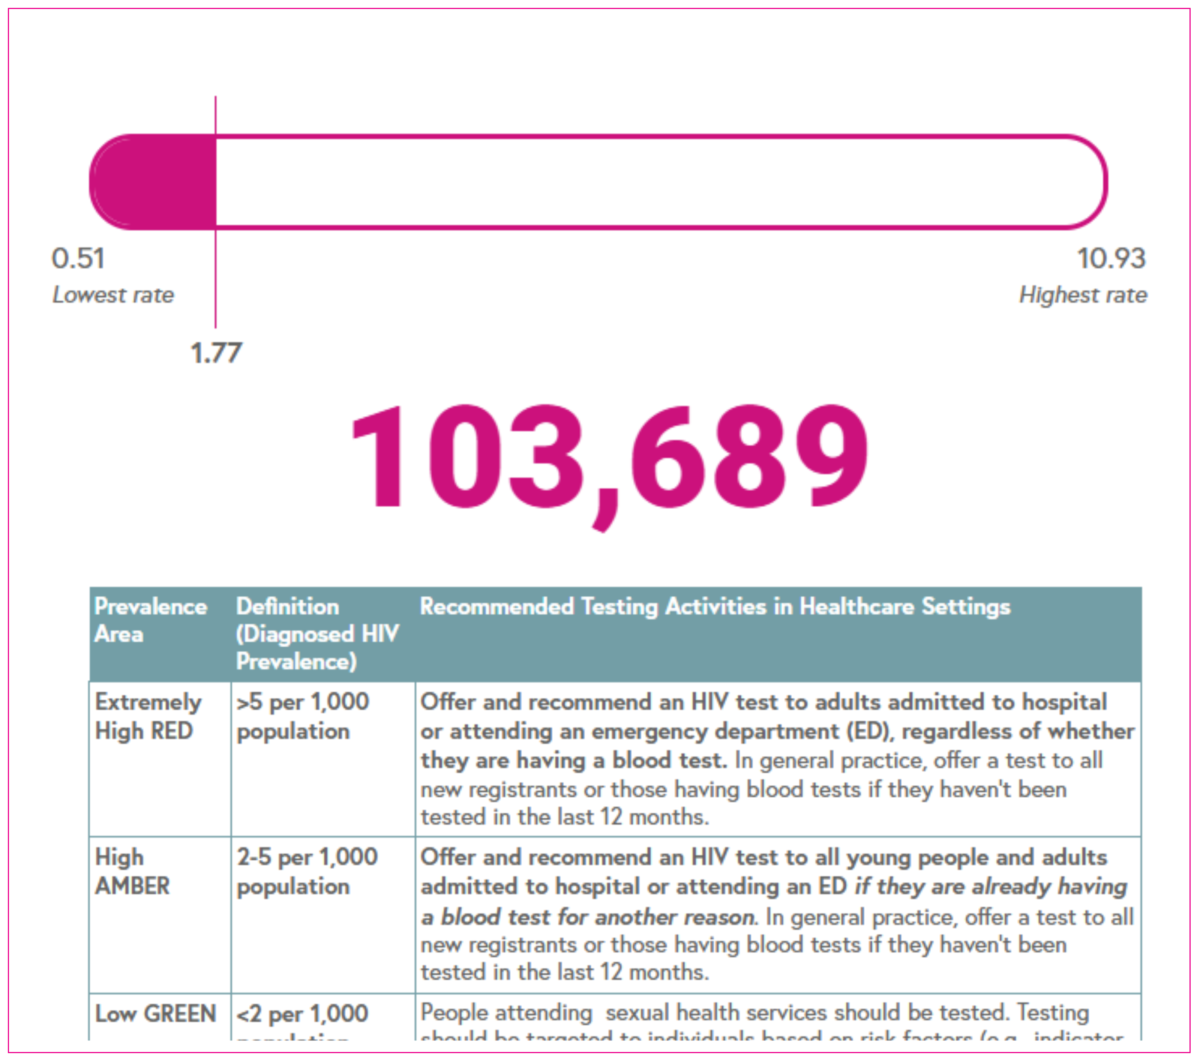
HIV testing guidelines
The rate of people living with a diagnosed HIV infection per 1,000 people aged 15-59 years is used to inform HIV testing guidelines.
Rates are categorised as follows:
- Red: Extremely high (>5 per 1,000)
- Amber: High (2-5 per 1,000)
- Green: Low (<2 per 1,000).
In areas with high and extremely high HIV prevalence, HIV testing services should be expanded outside of sexual health settings in accordance with NICE and BHIVA testing guidelines.
Breakdown: geographic region.
HIV testing rate
This measure shows the proportion of people living in a specific area who had an HIV test at a sexual health service. The higher the percentage, the better.
Breakdown: age, exposure, ethnicity (where available), and geographic region.
Proportion of people declining a test
The proportion of people declining a test shows the proportion of people attending a sexual health service who were offered, but declined an HIV test. The lower the percentage, the better.
Breakdown: age, exposure, ethnicity and geographic region (where available).
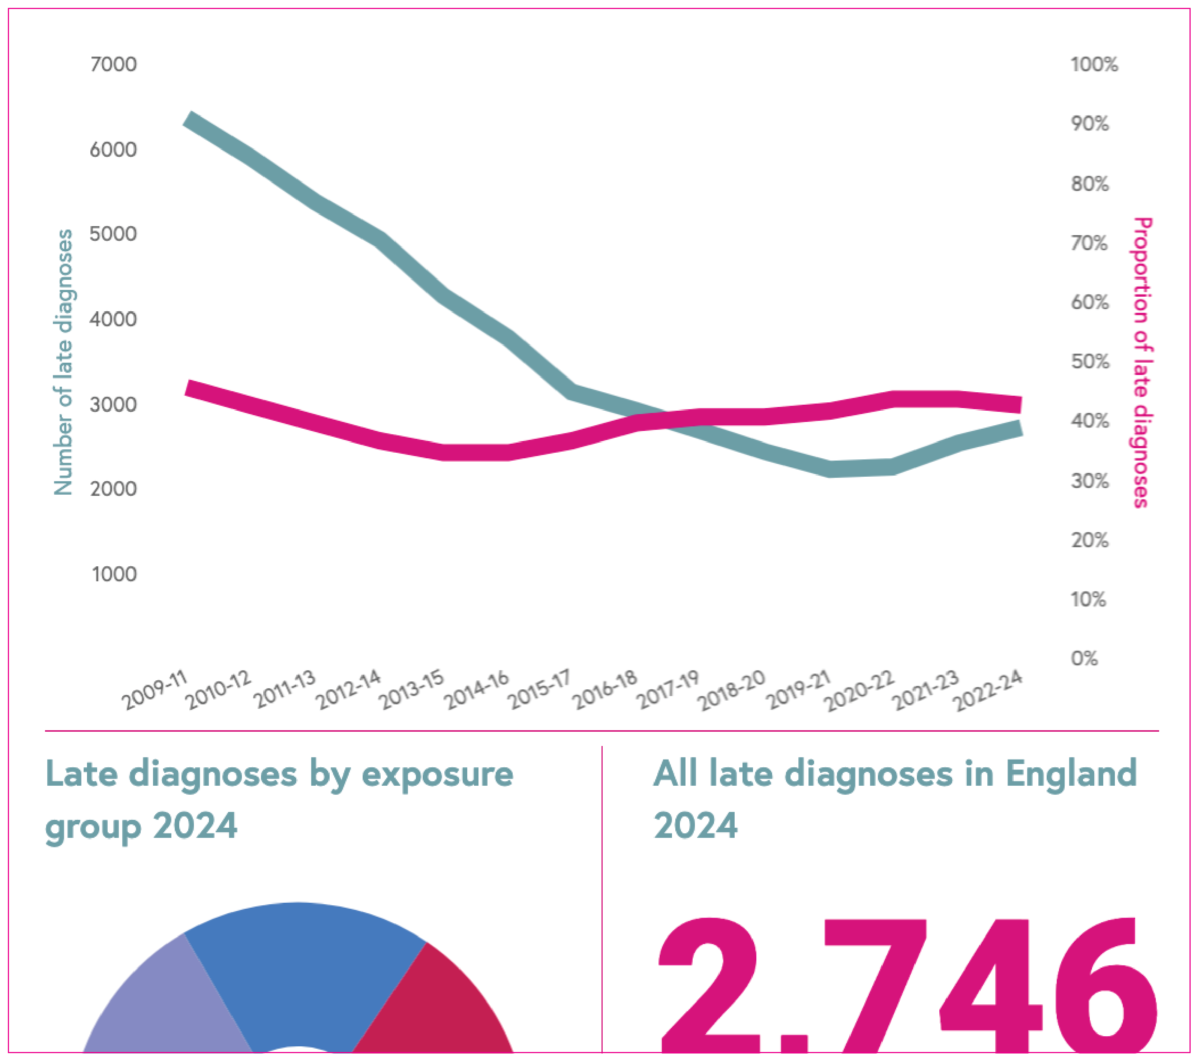
Late diagnoses
Adults (aged 15 years and over) only. The data measure the proportion and number of HIV diagnoses that are made with CD4 counts <350 cells within 91 days of diagnosis, which is indicative of a late stage of infection. The lower the percentage, the better.
A person diagnosed late has been living with an undiagnosed HIV infection for around three to five years and is more susceptible to infections compared to a person with a higher CD4 count. People diagnosed late have a tenfold increased risk of death compared to those diagnosed promptly.
People with a CD4 count <350 who have evidence of recently acquired HIV infection have been excluded.
Data are presented for three years combined.
Breakdown: exposure (where available), and geographic region of diagnosis.
Living with diagnosed HIV
The rate of people living with a diagnosed HIV infection per 1,000 people aged 15-59 years is used to inform HIV testing guidelines.
Rates are categorised as follows:
- Extremely high >5 per 1,000
- High 2-5 per 1,000
- Low <2 per 1,000.
In areas with high and extremely high HIV prevalence, HIV testing services should be expanded outside of sexual health settings in accordance with NICE and BHIVA testing guidelines.
We also show as a number the total number of adults (15 years and over) living with diagnosed HIV infection.
Breakdown: geographic region.
Treatment started within 91 days
This indicator presents the number and proportion of people newly diagnosed with HIV who start antiretroviral therapy within 91 days of their diagnosis. The higher the percentage, the better. HIV treatment saves lives and prevents onward HIV transmission.
Data is presented by area of residence and exclude people diagnosed with HIV in England who are resident in Wales, Scotland, Northern Ireland or abroad.
Breakdown: geographic region (where available).
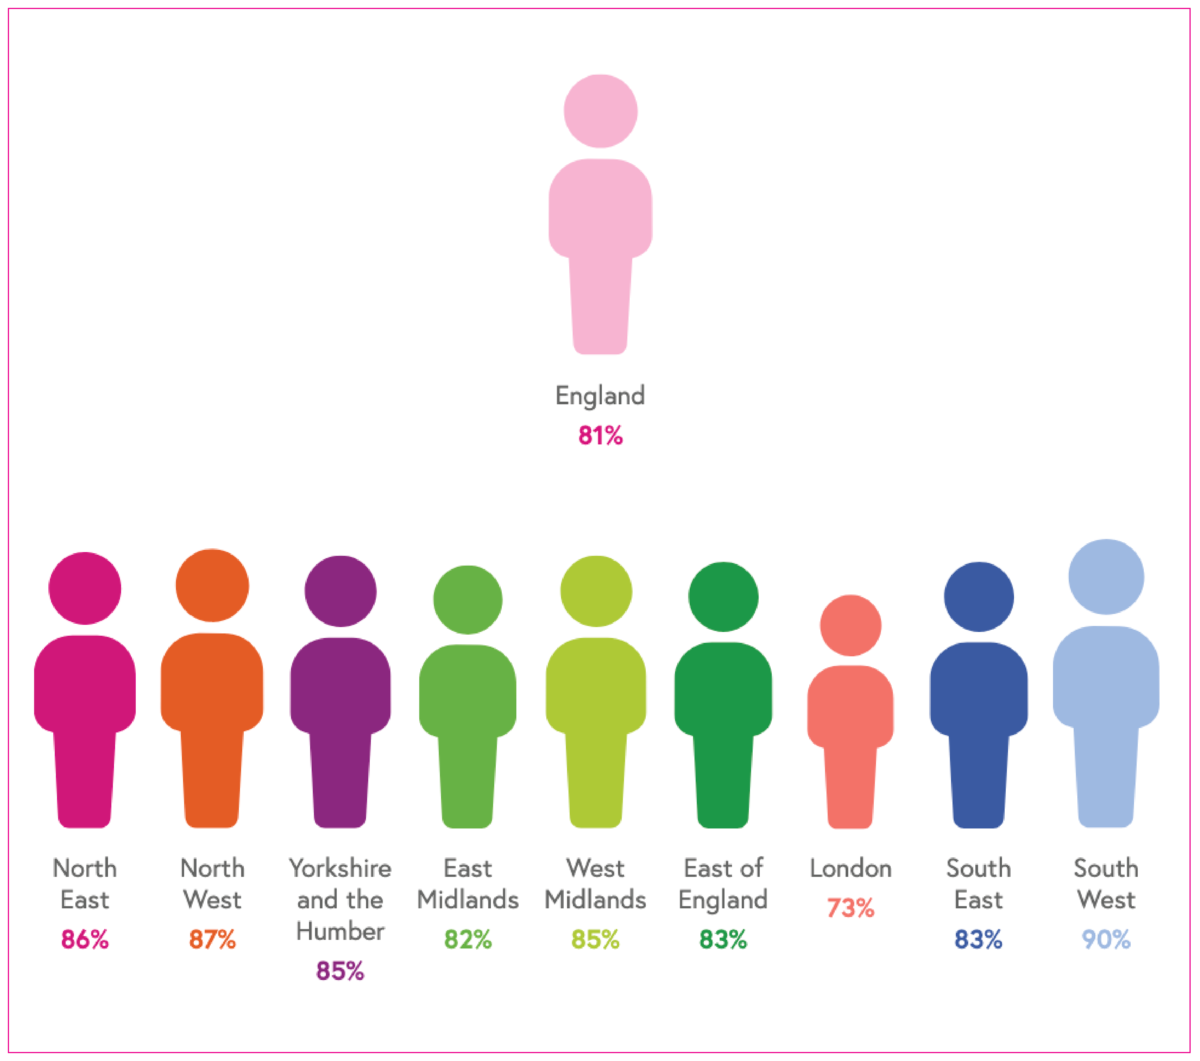
HIV treatment coverage
The number of people taking antiretroviral treatment at their last clinic attendance divided by everybody in HIV care. HIV treatment saves lives and prevents onward HIV transmission. The higher the percentage, the better.
Breakdown: age, exposure, ethnicity (where available), and geographic region.
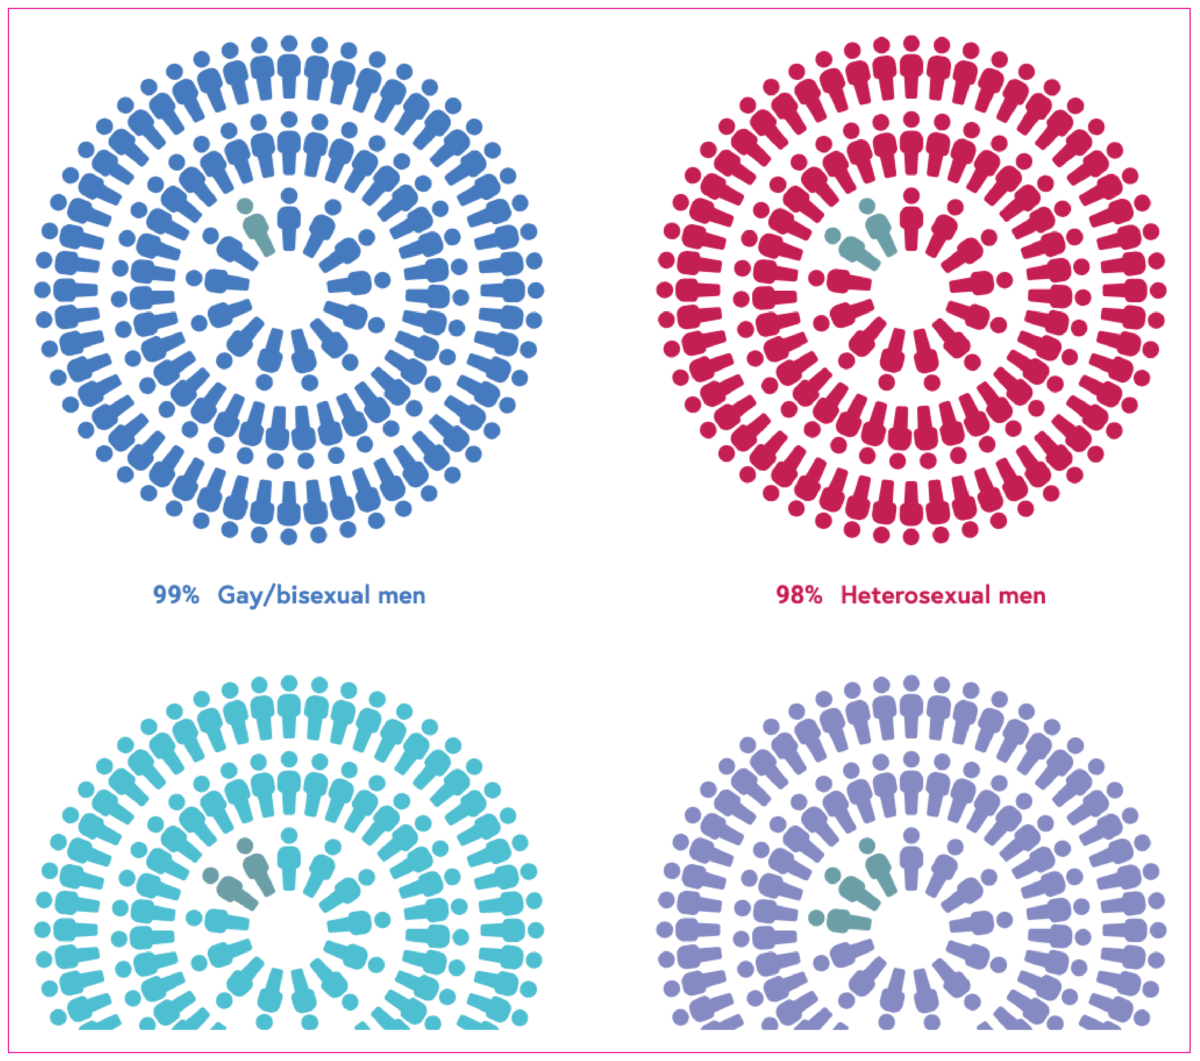
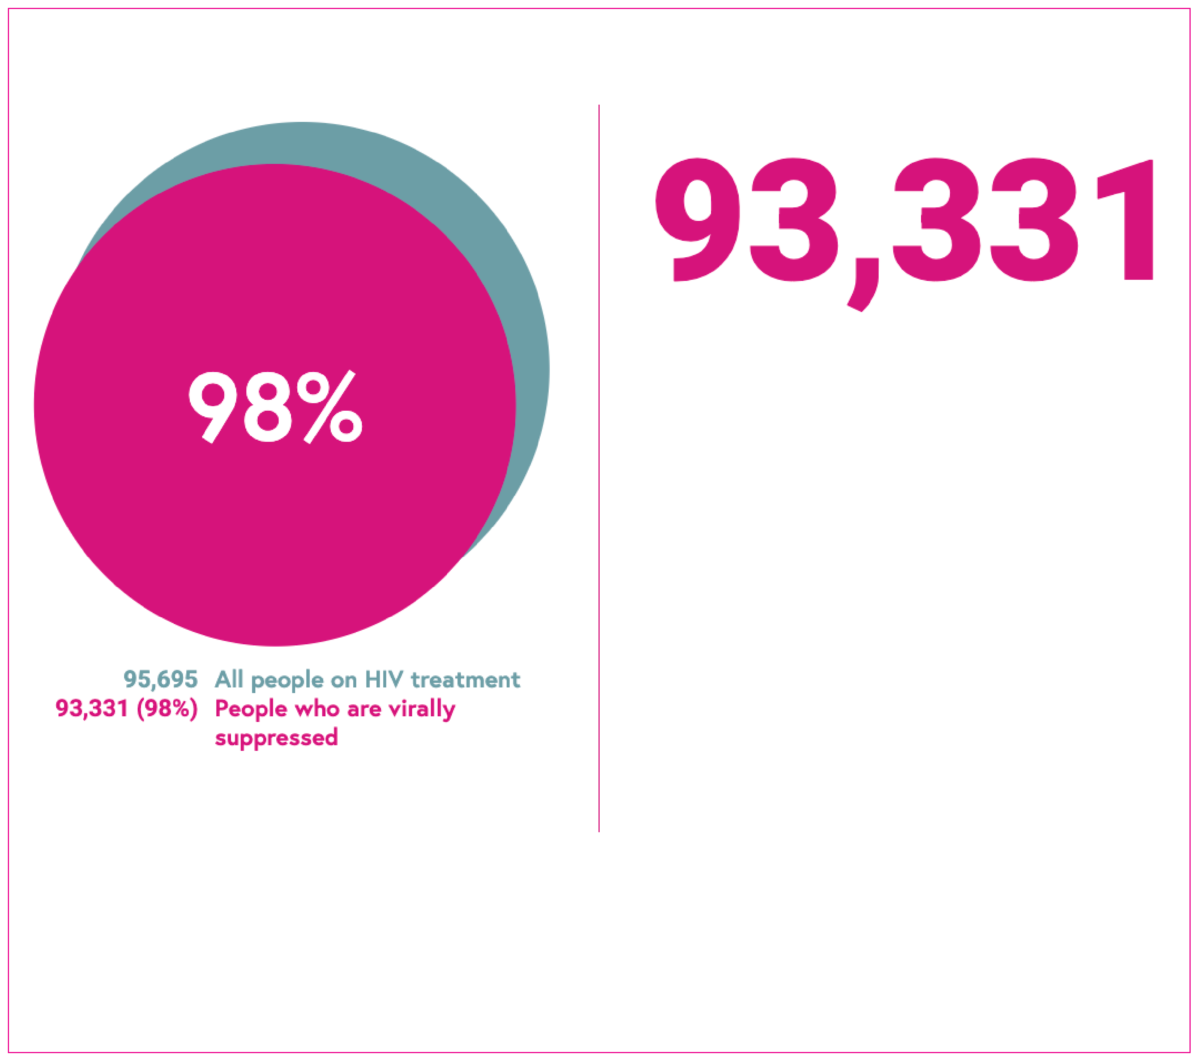
Viral suppression
A viral load under 200 copies/ml. The number of people who are virally suppressed (<200 copies/ml) divided by the number of people receiving HIV treatment. A person who has suppressed virus at this level is unable to pass on HIV infection to sexual partners. This is known as Undetectable = Untransmittable (U=U). The higher the percentage, the better.
Breakdown: geographic region.
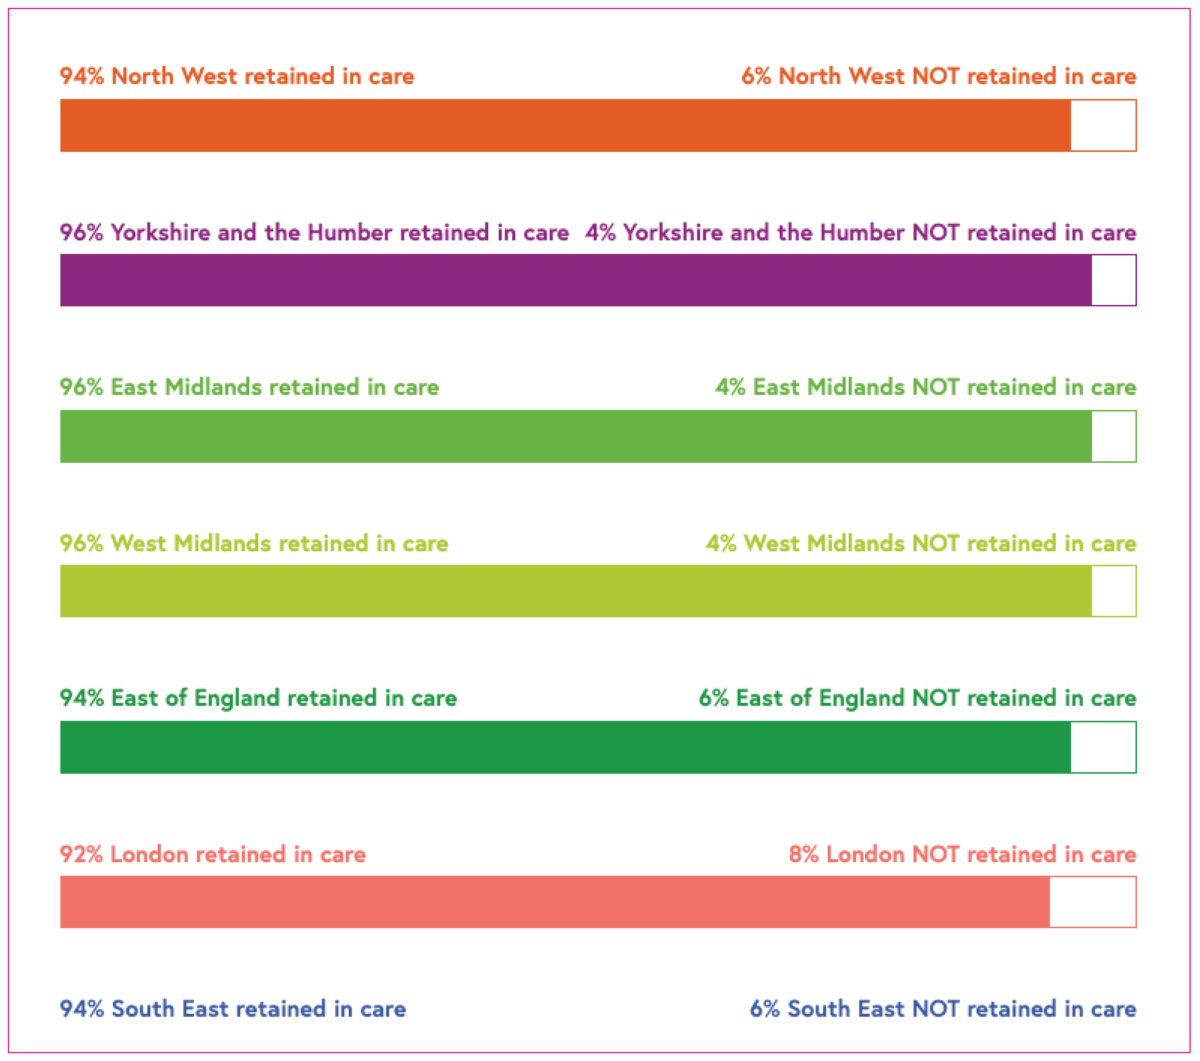
Retention in care
This indicator measures the extent people seen for HIV care are seen on an annual basis, in accordance with BHIVA standards of care. People in care have their HIV monitored to ensure good health, the right medication and to assess whether they are virally undetectable. The retention in care measure assesses the proportion of people seen within 15 months of their last attendance date up to and including October 2023. The higher the proportion, the better.
Breakdown: geographic region (where available).
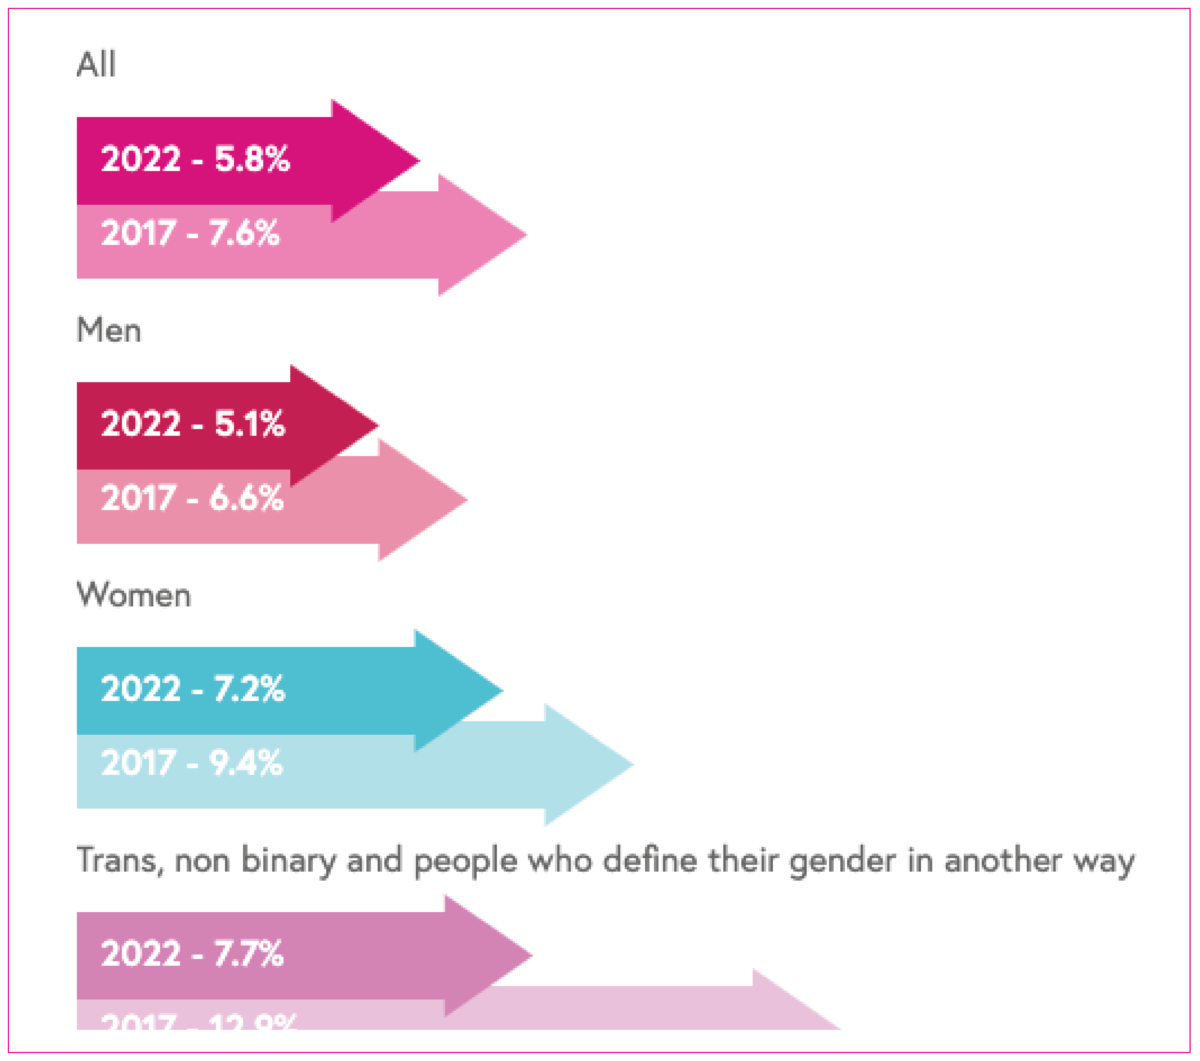
HIV stigma
Data is from the Positive Voices survey. This is a representative survey conducted in 2017 and 2022 of people living with HIV who provided information about their lived experience in relation to satisfaction with HIV care, treatment, co-morbidities, lifestyle, needs and unmet needs and stigma.
The questions asked about stigma related to life satisfaction, enacted stigma in healthcare settings (experiences of being treated badly), anticipated stigma (avoiding health care because of HIV stigma) and sharing one’s HIV status.
Breakdown: gender.
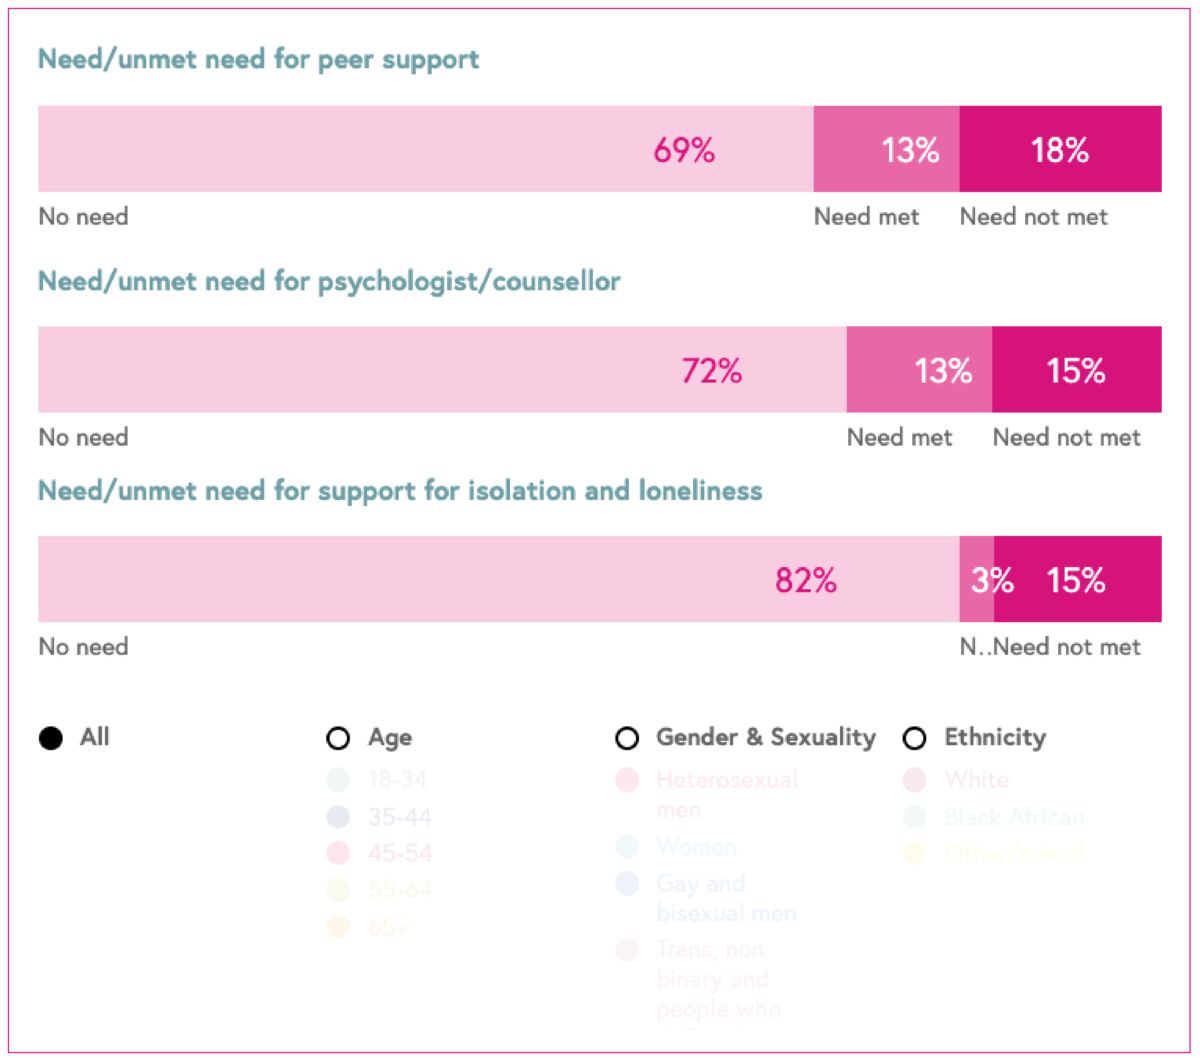
Needs of people living with HIV
Data relating to need is from the 2022 Positive Voices survey. Positive Voices was a representative survey conducted in 2017 and 2022 of people living with HIV who provided information about their lived experience in relation to satisfaction with HIV care, treatment, co-morbidities, lifestyle, needs and unmet needs and stigma.
The proportion of ‘need’ was defined as the percentage of people with HIV who stated their need for a service, out of all those who responded to the question. The proportion of ‘unmet need’ was defined as the percentage of people with HIV who did not receive it, out of those who stated they needed the service.
Breakdown: age, gender and sexuality, and ethnicity.